

NaN / 0
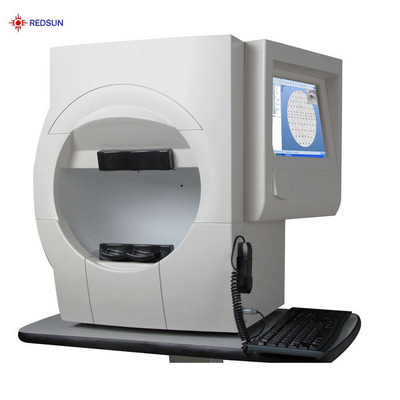
APS-TOO China ophthalmic equipment humphrey auto perimeter visual field analyzer
Get Latest Price
US$ 5800
≥5 Pieces
Quick Details
Warranty:
1years
Place of Origin:
China
Brand Name:
redsun
Model Number:
APS-T00
Product Details
humphrey visual field analyzer
(APS-TOO)
China ’s first full-field projection perimeter
Software and hardware design is fully in line with international standards.
Automated,user-friendly design,easier operation
Automatic pupil measurement, monitoring nd correction of eye position
3 minutes to complete the threshold perimetry
Report analysis is consistent with the international mainstream.
Technical Specification:
|
Model |
APS-TOO |
|
Device Type |
Integrated Type |
|
Stimulate point appearing way |
Optical projection |
|
Detection method |
Static perimetry |
|
Detection range |
0-90 degree |
|
Background light |
Yellow , white |
|
Background brightness |
White:31.5asb Yellow:315asb |
|
Visual Target color |
Red,blue,white |
|
Visual Target Brightness |
Oasb-10000asb |
|
Vision Target intervaltime |
≥ 200ms(customizable,no limit) |
|
Visual target holding time |
≥200ms(customizable,no limit) |
|
Brightness level |
0-51db |
|
Visual Target Size(Goldman) |
I Grade II Grade III Grade V Grade |
|
Detection strategy |
Full-threshold, fast threshold, custom, Two notation, three notation, quantify defects |
|
Threshold Policy |
Intelligent dynamic, fast intelligent dynamic, age-related, The threshold, a single strength |
|
Threshold Test Mode |
Center 10-2, Center 24-2, Center 30-2, Center 60-4, Nasal step, macula |
|
Fixation monitoring |
Dynamic real-time video monitoring, physiological blind spot monitoring, Eye tracking curve, eye position offset alarm |
|
Analysis Software |
Reliability analysis, analysis of a single vision, triple report analyzes |
|
Report Figure |
Value, grayscale, the overall bias decibel chart, The overall deviation probability map, chart pattern deviation decibels, Pattern deviation probability plot, staring Figure |

Hot Searches


